HomeTestsSearchRankProfile
mediumMCQAIEEE2026Physics
1 mark

A thin rod of length is lying along the -axis from to . Its linear density varies as . Which graph best approximates the dependence of the position of the centre of mass on ()?
image

  1. A
    1
  2. B
    2
  3. C
    3
  4. D
    4

Solution & Step-by-step Explanation

$
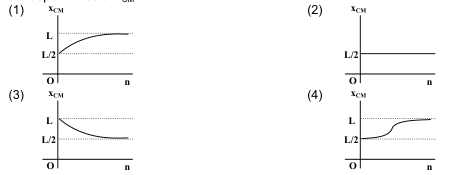
n=0 x_{CM} = L/2 n \to \infty x_{CM} \to L x_{CM} L/2 L n$ increases.

Practice this question

Try it yourself before checking the explanation above.

A thin rod of length is lying along the -axis from to . Its linear density varies as . Which graph best approximates the dependence of the position of the centre of mass on ()?
image
A
1
B
2
C
3
D
4

Share This Question

Related Questions

Ready for a Full Test?

Practice with timed mock tests and track your performance across Physics.

Discussion