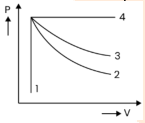
An ideal gas undergoes four different processes from the same initial state as shown in the figure below. Those processes are adiabatic, isothermal, isobaric and isochoric. The curve which represents the adiabatic process among 1, 2, 3 and 4 is:
- A1
- B2
- C3
- D4
Solution & Step-by-step Explanation
In the diagram starting from a common point:Curve 1: Vertical line, represents Isochoric process ().Curve 4: Horizontal line, represents Isobaric process ().Curve 3: Represents Isothermal process ().Curve 2: Represents Adiabatic process ().The slope of an adiabatic process is times steeper than the slope of an isothermal process (). Since for all gases, Curve 2 (steeper curve) is adiabatic.