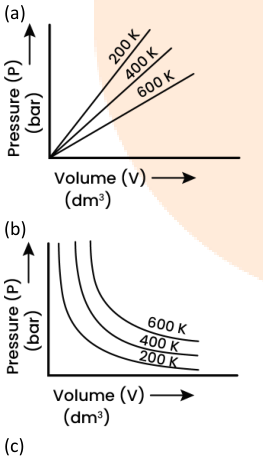
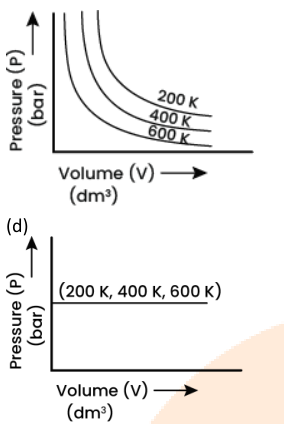
Choose the correct option for graphical representation of Boyle's law, which shows a graph of pressure vs. Volume of a gas at different temperature.
- Aa
- Bb
- Cc
- Dd
Solution & Step-by-step Explanation
Boyle's Law states at constant . The graph of vs is a rectangular hyperbola. Since , at a constant volume, as temperature increases, pressure increases. Therefore, the curve for a higher temperature () will be above the curve for a lower temperature ().Correct graph: Option B.