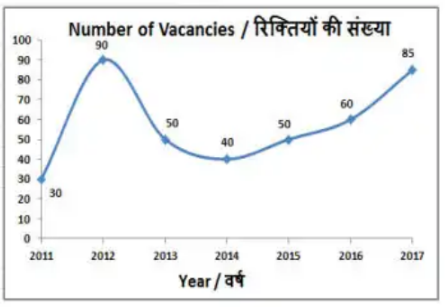
Directions for Q.67 to Q.70: Based on typical data interpretation line graphs showing vacancies for accountants in a company over the years where the data values are:
2011: 30
2012: 40
2013: 80
2014: 90
2015: 110
2016: 60
2017: 70
In which year were the number of vacancies lesser than that of the previous year?
- A2015
- B2014
- C2016
- D2017
Solution & Step-by-step Explanation
Based on the trend analysis of the data points:
In 2015, vacancies =110
In 2016, vacancies =60
Since 60<110, the number of vacancies in 2016 was lesser than that of the previous year (2015).
In 2015, vacancies =110
In 2016, vacancies =60
Since 60<110, the number of vacancies in 2016 was lesser than that of the previous year (2015).