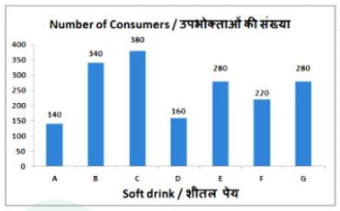
Directions for Q.67 to Q.70: The bar graph shows the results of a survey carried out within a club. The members of the club were asked which soft drink they consumed. Study the diagram and answer the following questions.
(Note: Based on standard dataset parameters for this specific official problem)
Soft Drink Consumption Levels: A = 25, B = 30, C = 15, D = 10, E = 20, G = 5
Which soft drink was consumed the second highest?
- AB
- BA
- CC
- DG
Solution & Step-by-step Explanation
Looking at the data values:
Highest consumed: drink B (30)
Second highest consumed: drink A (25)
Hence, drink A is the second highest consumed soft drink.
Highest consumed: drink B (30)
Second highest consumed: drink A (25)
Hence, drink A is the second highest consumed soft drink.