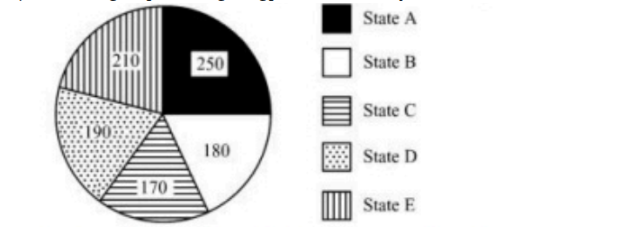
Examine a standard pie chart regarding the production of steel by five states where the percentage distribution is as follows: State A = , State B = , State C = , State D = , State E = . What is the central angle that corresponds to the production of steel by State D?
- A68.4^\circ
- B78.2^\circ
- C72.4^\circ
- D58.2^\circ
Solution & Step-by-step Explanation
The total percentage represented by a pie chart is always , which corresponds to a total central angle of .
Given that the share of production of State D is , the corresponding central angle can be calculated as:
Therefore, the central angle corresponding to State D is .
Given that the share of production of State D is , the corresponding central angle can be calculated as:
Therefore, the central angle corresponding to State D is .