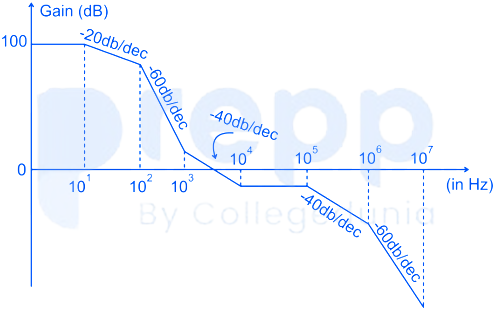
For an LTI system, the Bode plot for its gain is as illustrated in the figure shown. The number of system poles N ₚand the number of system zeros N in the frequency range 1 Hz ≤ f ≤ 10 ⁷Hz is
- AN ₚ= 5, N = 2
- BN ₚ= 6, N = 3
- CN ₚ= 7, N = 4
- DN ₚ= 4, N = 2
Solution & Step-by-step Explanation
Concept:
- The slope of the bode plot decreases by 20 dB/decade at the pole
- The slope of the bode plot increases by 20 dB/decade at zero
Application:
Total poles: 6 = N
Total zeros: 3 = N
- The slope of the bode plot decreases by 20 dB/decade at the pole
- The slope of the bode plot increases by 20 dB/decade at zero
Application:
| Frequency (Hz) | Change of slope | No-of poles /zeroes |
|---|---|---|
| 10 | -20 dB/dec | 1 pole |
| 100 | -40 dB/dec | 2 pole |
| 1000 | +20 dB/decade | 1 zero |
| 10,000 | +40 dB/decade | 2 zero |
| 10 ⁵ | -40 dB/dec | 2 pole |
| 10 ⁶ | -20 dB/dec | 1 pole |
Total zeros: 3 = N