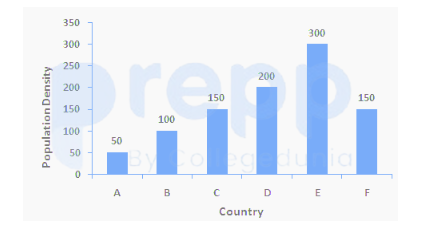
From the bar graph given in image_9b4085.png, the graph shows the population density of 6 countries. Population density is measured as the number of people living per square kilometre. What is the ratio of the population density of country A to country F?
- A3:1
- B1:5
- C5:1
- D1:3
Solution & Step-by-step Explanation
From the given bar graph, identify the population density values for countries A and F:
1. Population density of country A =
2. Population density of country F =
Calculate the required ratio of country A to country F:
1. Population density of country A =
2. Population density of country F =
Calculate the required ratio of country A to country F: