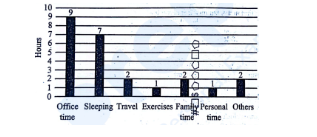
A bar graph shows the number of hours spent on various daily activities: Sleep: 8 hours, Office: 9 hours, Entertainment: 2 hours, Travel: 2 hours, Others: 3 hours. From the given data, calculate the number of hours spent on both travel and office time together.
- A11 hours
- B9 hours
- C13 hours
- D7 hours
Solution & Step-by-step Explanation
From the dataset representing daily activities:
* Hours spent on Travel =
* Hours spent on Office time =
To find the total time spent on both activities together:
* Hours spent on Travel =
* Hours spent on Office time =
To find the total time spent on both activities together: