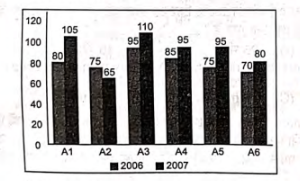
The data from the given bar graph showing the sales of books (in thousands) from six branches ( to ) of a publishing company during two consecutive years and is tabulated below:
What is the ratio of the total sales of branch for both years to the total sales of branch for both years?
- A
- B
- C
- D
Solution & Step-by-step Explanation
From the given data table, let's compute the total sales for the required branches:
1. **Total sales of branch for both years ( and ):**
2. **Total sales of branch for both years ( and ):**
3. Required Ratio:
Simplifying the fraction by dividing both the numerator and denominator by :
Therefore, the required ratio is .
1. **Total sales of branch for both years ( and ):**
2. **Total sales of branch for both years ( and ):**
3. Required Ratio:
Simplifying the fraction by dividing both the numerator and denominator by :
Therefore, the required ratio is .