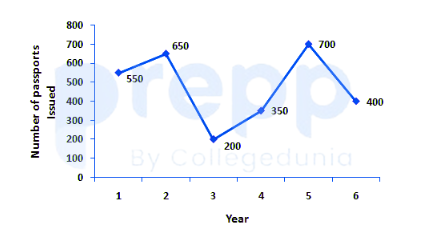
the graph shows the number of passports issued by the Passport Office in the last 6 years. In how many years was the number of passports issued more than those issued in the previous year?
- A2
- B4
- C1
- D3
Solution & Step-by-step Explanation
Let's compare the number of passports issued in each year with its immediate previous year:
* Year 2: (Previous year 1 was ) (Increase)
* Year 3: (Previous year 2 was ) (Decrease)
* Year 4: (Previous year 3 was ) (Increase)
* Year 5: (Previous year 4 was ) (Increase)
* Year 6: (Previous year 5 was ) (Decrease)
The number of passports issued was more than the previous year in exactly 3 years (Year 2, Year 4, and Year 5).
* Year 2: (Previous year 1 was ) (Increase)
* Year 3: (Previous year 2 was ) (Decrease)
* Year 4: (Previous year 3 was ) (Increase)
* Year 5: (Previous year 4 was ) (Increase)
* Year 6: (Previous year 5 was ) (Decrease)
The number of passports issued was more than the previous year in exactly 3 years (Year 2, Year 4, and Year 5).