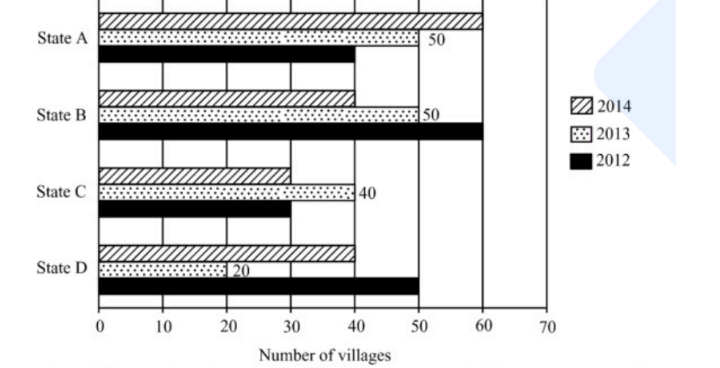
The given graph shows the number of villages in four different states where electrification was done in different years.
The number of villages in State B where electrification was done in 2014 is what percentage of the number of villages in State D where electrification was done in 2012?
- A33.33%
- B65%
- C40%
- D80%
Solution & Step-by-step Explanation
From the given bar graph:
1. Find the number of villages in State B where electrification was done in 2014 (represented by the hatched bar):
2. Find the number of villages in State D where electrification was done in 2012 (represented by the black bar):
3. Calculate the required percentage:
1. Find the number of villages in State B where electrification was done in 2014 (represented by the hatched bar):
2. Find the number of villages in State D where electrification was done in 2012 (represented by the black bar):
3. Calculate the required percentage: