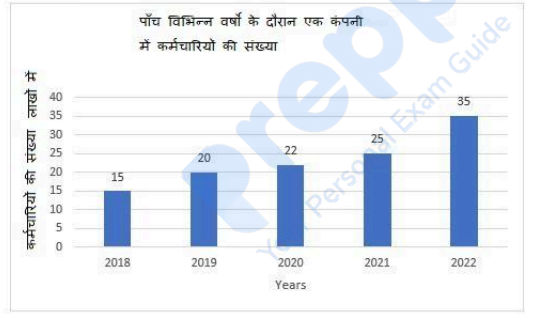
Study the given bar graph and answer the following question. The bar graph shows the number of employees (in lakhs) in a company across five different years:
By what percentage did the number of employees increase in the year 2022 compared to the year 2019?
- A
- B
- C
- D
Solution & Step-by-step Explanation
From the given bar graph, we can determine the values for the respective years:
* Number of employees in 2019 =
* Number of employees in 2022 =
Now, find the increase in the number of employees:
Calculate the percentage increase compared to 2019:
* Number of employees in 2019 =
* Number of employees in 2022 =
Now, find the increase in the number of employees:
Calculate the percentage increase compared to 2019: