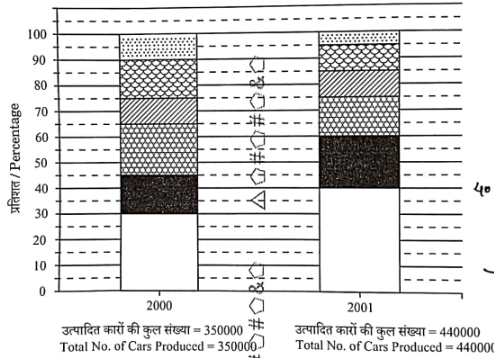
The Bar chart given below shows the percentage of six different types of cars manufactured by a company over two years.
If the percentage production of type cars in was the same as that in , then what would be the number of type cars produced in ?
- A
- B
- C
- D
Solution & Step-by-step Explanation
Let's analyze the given component bar chart for type cars:
* In the year , the block for starts from and goes up to . Therefore, the percentage production of type cars in .
* According to the question, the percentage production of type cars in is assumed to be the same as in , which is .
Given that the total number of cars produced in is .
Now, calculate the number of type cars produced in :
Thus, the required number of cars is .