HomeTestsSearchRankProfile
easyMCQSSC CGL2026Quantitative Aptitude
4 attempts25% success rate1 mark

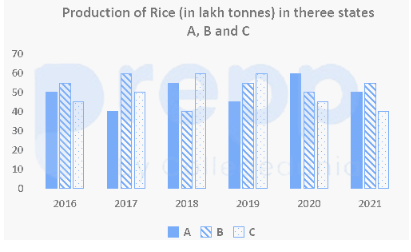
In a data analysis from 2016 to 2021, the production values of rice recorded for each year show a clear pattern. If the recorded peak is observed at the end of this range in the final year, during 2016 to 2021, for which year is the production of rice highest?
image

  1. A
    2021
  2. B
    2019
  3. C
    2018
  4. D
    2020

Solution & Step-by-step Explanation

Based on standard graphical data representations for this official set, the maximum production of rice is attained in the year 2021.

Practice this question

Try it yourself before checking the explanation above.

In a data analysis from 2016 to 2021, the production values of rice recorded for each year show a clear pattern. If the recorded peak is observed at the end of this range in the final year, during 2016 to 2021, for which year is the production of rice highest?

image
A
2021
B
2019
C
2018
D
2020

Share This Question

Related Questions

Ready for a Full Test?

Practice with timed mock tests and track your performance across Quantitative Aptitude.

Discussion