HomeTestsSearchRankProfile
easyMCQCompetitive Exam2026Quantitative Aptitude
1 attempts0% success rate1 mark

In a factory, the distribution of workers across different categories is represented on a pie chart. If category D accounts for exactly th () of the total workforce distribution, what is the central angle (angular value) for category D on the pie chart?
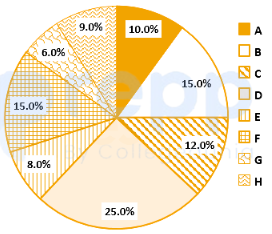
image

  1. A
  2. B
  3. C
  4. D

Solution & Step-by-step Explanation

The total angle around the center of a pie chart is always .Given that category D represents th of the total share:

Practice this question

Try it yourself before checking the explanation above.

In a factory, the distribution of workers across different categories is represented on a pie chart. If category D accounts for exactly th () of the total workforce distribution, what is the central angle (angular value) for category D on the pie chart?

image
A
B
C
D

Share This Question

Related Questions

Ready for a Full Test?

Practice with timed mock tests and track your performance across Quantitative Aptitude.

Discussion