In a uniformly charged sphere of total charge and radius , the electric field is plotted as a function of distance from the centre. The graph which would correspond to the above will be:
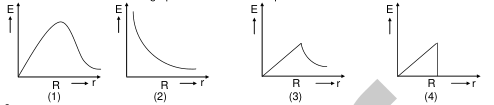
- A1
- B2
- C3
- D4
Solution & Step-by-step Explanation
Inside a uniformly charged non-conducting sphere (): Outside the sphere (): At , .The graph starts from zero at the centre, increases linearly up to , and then decreases following an inverse square law. This matches Graph (3) in standard textbook representations.