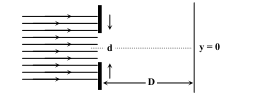
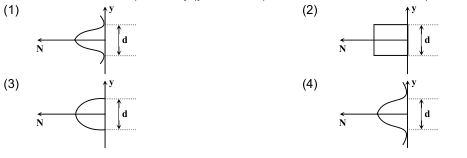
In an experiment, electrons pass through a narrow slit of width ‘ ’. They are detected on a screen at a distance ‘ ’. Which graph correctly represents the number of electrons detected as a function of the detector position ( corresponds to the middle of the slit)?
- A1
- B2
- C3
- D4
Solution & Step-by-step Explanation
Since electrons exhibit wave properties, they undergo diffraction when passing through a slit comparable to their wavelength. This results in a typical diffraction pattern characterized by a central maximum and smaller intensity secondary maxima on either side.