Out of the two bar graphs provided below, one shows the amount (in Lakh Rs.) invested by a Company in purchasing raw materials over the years and the other shows the values (in Lakh Rs.) of finished goods sold by the Company over the years.
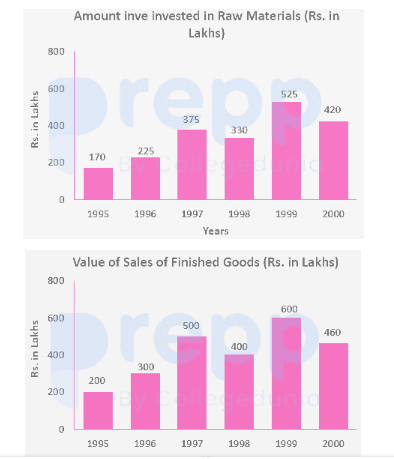
What was the difference between the average amount invested in Raw materials during the given period and the average value of sales of finished goods during this period?
- ARs.
- BRs.
- CRs.
- DRs.
Solution & Step-by-step Explanation
1. Calculate the average amount invested in Raw Materials:
2. Calculate the average value of sales of Finished Goods:
3. Find the absolute difference between the two averages:
2. Calculate the average value of sales of Finished Goods:
3. Find the absolute difference between the two averages: