Out of the two bar graphs provided, one shows the amount (in Lakh ) invested by a Company in purchasing raw materials over the years and the other shows the values (in Lakh ) of finished goods sold by the Company over the years.
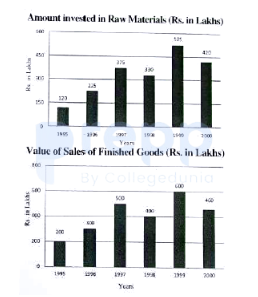
The value of sales of finished goods in 1999 was approximately what percent of the sum of the amount invested in Raw materials in the years 1997, 1998, and 1999?
- A
- B
- C
- D
Solution & Step-by-step Explanation
1. From the second dataset, identify the value of sales of finished goods in 1999:
2. From the first dataset, calculate the sum of the amount invested in raw materials for the years 1997, 1998, and 1999:
3. Calculate the required percentage:
2. From the first dataset, calculate the sum of the amount invested in raw materials for the years 1997, 1998, and 1999:
3. Calculate the required percentage: