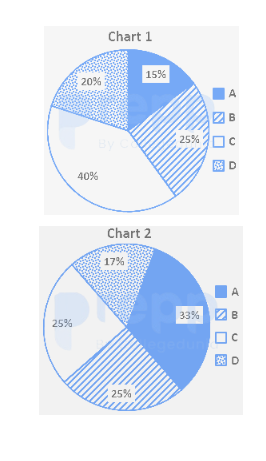
Pie chart (1) shows investments of lakh rupees by four partners in a certain business. Pie Chart (2) shows number of hours worked for the business by each partner. The business earned a profit of . Half of this profit is to be distributed between the 4 partners in proportion of investment and the rest in proportion of number of hours worked. How much will D get? (In lakh rupees)
- A4.44
- B3.66
- C4
- D4.8
Solution & Step-by-step Explanation
Let's break down the total profit of into two equal halves of each:
1. **First Half () distributed based on Investment (Chart 1)**:
Looking at the legend sequence from top to bottom (A, B, C, D) corresponding to clockwise segments or values:
The shares are (for A), (for B), (for C), and (for D).
2. **Second Half () distributed based on Hours Worked (Chart 2)**:
Looking at the values: (for A), (for B), (for C), and (for D).
3. Total Share of D:
1. **First Half () distributed based on Investment (Chart 1)**:
Looking at the legend sequence from top to bottom (A, B, C, D) corresponding to clockwise segments or values:
The shares are (for A), (for B), (for C), and (for D).
2. **Second Half () distributed based on Hours Worked (Chart 2)**:
Looking at the values: (for A), (for B), (for C), and (for D).
3. Total Share of D: