Study the following data carefully:
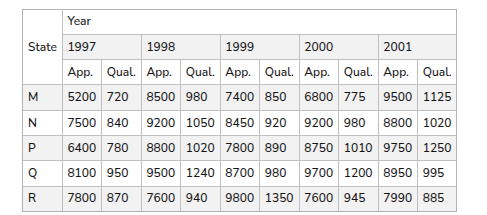
In which of the given years the number of candidates appeared from State P has maximum percentage of qualified candidates?
- A
- B
- C
- D
Solution & Step-by-step Explanation
Let's calculate the percentage of qualified candidates from State P for each of the years given in the options:
* For 1997:
* For 1998:
* For 1999:
* For 2001:
Comparing the percentages:
The maximum percentage of qualified candidates from State P is in the year .
* For 1997:
* For 1998:
* For 1999:
* For 2001:
Comparing the percentages:
The maximum percentage of qualified candidates from State P is in the year .