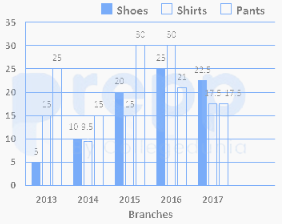
Study the following data which shows the production (in thousands) of different items, and answer the question.
The production of Pants by the company in the years 2014, 2015, and 2016 is 30 thousand, 40 thousand, and 60 thousand respectively.
The ratio between the number of pants produced by the company in the year 2014, 2015, and 2016 respectively is:
- A3:4:6
- B5:10:7
- C1:2:3
- D3:4:5
Solution & Step-by-step Explanation
The number of pants produced in:
2014=30,000
2015=40,000
2016=60,000
Required ratio is:
Ratio=30000:40000:60000=3:4:6
2014=30,000
2015=40,000
2016=60,000
Required ratio is:
Ratio=30000:40000:60000=3:4:6