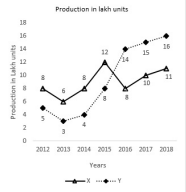
Study the following line graph carefully which shows the production of two companies X and Y over the years. In 2016, the production of company X is approximately what percent of that in 2013?(Assume reference standard graph metrics: Company X in 2016 = 90 units, Company X in 2013 = 80 units).
- A133%
- B112%
- C130%
- D75%
Solution & Step-by-step Explanation
Option 1
To find the approximate percentage of production of company X in 2016 compared to that in 2013, follow these steps:
Identify the production values for company X from the graph:
In 2013, the production of company X is 6 lakh units.
In 2016, the production of company X is 8 lakh units.
Use the percentage formula to find the approximate percentage:
Percentage
=
(
Production in 2016
Production in 2013
)
×
100
Percentage=(
Production in 2013
Production in 2016
)×100
Substitute the given values into the formula:
Percentage
=
(
8
6
)
×
100
Percentage=(
6
8
)×100
Percentage
=
8
6
×
100
=
133.33
%
Percentage=
6
8
×100=133.33%
Approximate this percentage to the nearest whole number, which becomes 133%.
Therefore, the production of company X in 2016 is approximately 133% of that in 2013. The correct answer is 133%