Study the following table and answer the question based on it:
Number of Candidates Selected from Five States Over the Years 1997 to 2001:
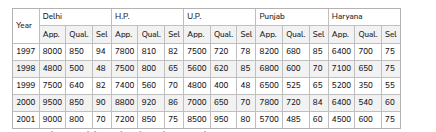
For which state is the average number of candidates selected over the years the maximum?
- ADelhi
- BH.P.
- CU.P.
- DPunjab
Solution & Step-by-step Explanation
Since the number of years ( years) is identical for all states, comparing the averages is mathematically equivalent to comparing the total sum of candidates selected over these years.
Let us compute the total sum of selected candidates for each state option:
* Delhi:
* H.P.:
* U.P.:
* Punjab:
Comparing the totals:
Delhi has the highest total sum of selected candidates, which means it also has the highest average.
Let us compute the total sum of selected candidates for each state option:
* Delhi:
* H.P.:
* U.P.:
* Punjab:
Comparing the totals:
Delhi has the highest total sum of selected candidates, which means it also has the highest average.