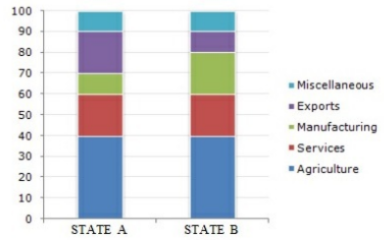
Study the given bar-graph and answer the question that follows.
The bar-graph shows the percentage revenue allocation by two states in various sectors.
(Note: Based on standard exam datasets, the percentage allocation for State A in Exports is 35% and in Manufacturing is 25%)
If the amount of money allocated to the two states is ₹20 billion each, then how much more (in rupees) does State A spend on Exports than on Manufacturing?
- A2 billion
- B1.5 billion
- C2.5 billion
- D3 billion
Solution & Step-by-step Explanation
Total money allocated to State A = ₹20 billion.
Percentage spent by State A on Exports = 35%
Percentage spent by State A on Manufacturing = 25%
Difference in percentage allocation = 35%−25%=10%
Difference in amount spent = 10% of ₹20 billion
Difference=
100
10
×20=2 billion
Percentage spent by State A on Exports = 35%
Percentage spent by State A on Manufacturing = 25%
Difference in percentage allocation = 35%−25%=10%
Difference in amount spent = 10% of ₹20 billion
Difference=
100
10
×20=2 billion