HomeTestsSearchRankProfile
mediumMCQCompetitive Exam2026Quantitative Aptitude
1 attempts0% success rate1 mark

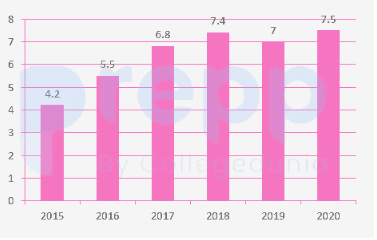
Study the given bar-graph and answer the question that follows.A company in India exports ready-made clothes. The bar-graph indicates the export of clothes (in crores of rupees) over from to .YearExport (in crores of rupees)20155.220166.520177.820189.220194.620205.1Find the average export of clothes over the years to (in crores of rupees).
image

  1. A
    5.4
  2. B
    6.4
  3. C
    5.2
  4. D
    6.2

Solution & Step-by-step Explanation

To find the average export of clothes over the , sum up the data values and divide by :

Practice this question

Try it yourself before checking the explanation above.

Study the given bar-graph and answer the question that follows.A company in India exports ready-made clothes. The bar-graph indicates the export of clothes (in crores of rupees) over from to .YearExport (in crores of rupees)20155.220166.520177.820189.220194.620205.1Find the average export of clothes over the years to (in crores of rupees).

image
A
5.4
B
6.4
C
5.2
D
6.2

Share This Question

Related Questions

Ready for a Full Test?

Practice with timed mock tests and track your performance across Quantitative Aptitude.

Discussion