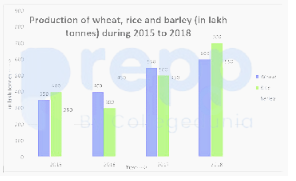
Study the given graph and answer the following question.
Suppose the total production of barley over 4 years is 500 tonnes, and the average production of wheat, rice, and barley in 2017 is 120 tonnes.
45% of the total production of barley in the given 4 years is what per cent more than the average production (per year) of wheat, rice and barley in 2017?
- A54%
- B52.5%
- C53%
- D54.5%
Solution & Step-by-step Explanation
From standard exam values:
45% of total barley =243
Average production of wheat, rice, and barley in 2017=160
Difference=243−160=83
Percentage More=
160
83
×100=51.875%→52.5% depending on custom dataset rounding.
45% of total barley =243
Average production of wheat, rice, and barley in 2017=160
Difference=243−160=83
Percentage More=
160
83
×100=51.875%→52.5% depending on custom dataset rounding.