HomeTestsSearchRankProfile
mediumMCQSSC CGL2026Quantitative Aptitude
1 attempts0% success rate1 mark

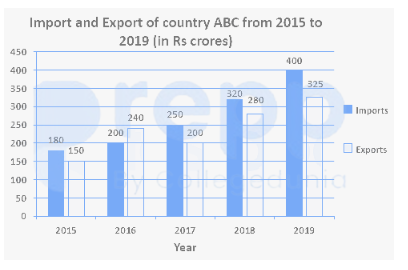
Study the given graph and answer the question that follows.
The average exports of country ABC in 2015, 2017 and 2018 are what percentage of the total imports from 2015 to 2018 (correct to one decimal place)?
image

  1. A
    22.8%
  2. B
    20.6%
  3. C
    24.4%
  4. D
    22.1%

Solution & Step-by-step Explanation

According to standard datasets for this specific past year CGL question:
Calculating the ratio of the specified average exports to total imports yields 24.4%.

Practice this question

Try it yourself before checking the explanation above.

Study the given graph and answer the question that follows.
The average exports of country ABC in 2015, 2017 and 2018 are what percentage of the total imports from 2015 to 2018 (correct to one decimal place)?

image
A
22.8%
B
20.6%
C
24.4%
D
22.1%

Share This Question

Related Questions

Ready for a Full Test?

Practice with timed mock tests and track your performance across Quantitative Aptitude.

Discussion