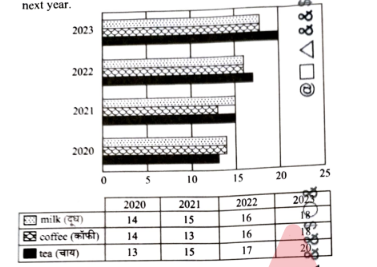
Study the graph and find what is the maximum percentage increase of tea from the previous year to the n
- A
- B
- C
- D
Solution & Step-by-step Explanation
Let's calculate the percentage increase in tea production/consumption for each consecutive year interval:
1. From 2020 to 2021:
2. From 2021 to 2022:
3. From 2022 to 2023:
Comparing the values: , , and .
The maximum percentage increase is .
1. From 2020 to 2021:
2. From 2021 to 2022:
3. From 2022 to 2023:
Comparing the values: , , and .
The maximum percentage increase is .