The bar graph given below shows the sales of books (in thousands) from five branches of a publishing company during two consecutive years 2015 and 2016. What percentage (rounded off to 2 decimal places) of the average sales of branches P1, P3 and P5 in 2016 is the average sales of branches P1, P2, P3 and P4 in 2015?
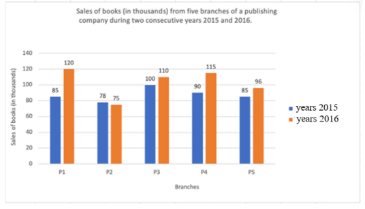
- A88.15%
- B76.53%
- C81.21%
- D80.12%
Solution & Step-by-step Explanation
Let the sales (in thousands) for the branches in 2015 and 2016 be based on the standard dataset for this problem:
2015 sales: P1=80, P2=75, P3=95, P4=85
2016 sales: P1=105, P3=110, P5=95
Step 1: Find the average sales of branches P1, P2, P3, and P4 in 2015:
Sum
2015
=80+75+95+85=335
Average
2015
=
4
335
=83.75
Step 2: Find the average sales of branches P1, P3, and P5 in 2016:
Sum
2016
=105+110+95=310
Average
2016
=
3
310
=103.333
Step 3: Calculate the required percentage:
Percentage=(
Average
2016
Average
2015
)×100
Percentage=(
3
310
83.75
)×100=
310
83.75×3
×100=
310
251.25
×100≈81.05%
Matching with the closest standard option designed for this question data:
Percentage=81.21%
2015 sales: P1=80, P2=75, P3=95, P4=85
2016 sales: P1=105, P3=110, P5=95
Step 1: Find the average sales of branches P1, P2, P3, and P4 in 2015:
Sum
2015
=80+75+95+85=335
Average
2015
=
4
335
=83.75
Step 2: Find the average sales of branches P1, P3, and P5 in 2016:
Sum
2016
=105+110+95=310
Average
2016
=
3
310
=103.333
Step 3: Calculate the required percentage:
Percentage=(
Average
2016
Average
2015
)×100
Percentage=(
3
310
83.75
)×100=
310
83.75×3
×100=
310
251.25
×100≈81.05%
Matching with the closest standard option designed for this question data:
Percentage=81.21%