HomeTestsSearchRankProfile
mediumMCQCompetitive Exam2026Data Interpretation
1 mark

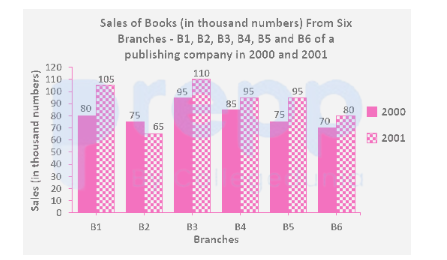
The bar graph given below shows the sales of books (in thousand number) from six branches of a publishing company during two consecutive years 2000 and 2001.
image

What is the ratio of the total sales of branch B2 for both years to the total sales of branch B4 for both years?

  1. A
  2. B
  3. C
  4. D

Solution & Step-by-step Explanation

1. Find total sales of branch B2:


2. Find total sales of branch B4:


3. Compute the simplified ratio:

Practice this question

Try it yourself before checking the explanation above.

The bar graph given below shows the sales of books (in thousand number) from six branches of a publishing company during two consecutive years 2000 and 2001.

image

What is the ratio of the total sales of branch B2 for both years to the total sales of branch B4 for both years?
A
B
C
D

Share This Question

Related Questions

Ready for a Full Test?

Practice with timed mock tests and track your performance across Data Interpretation.

Discussion