HomeTestsSearchRankProfile
mediumMCQSSC CGL2026Quantitative Aptitude
1 attempts100% success rate1 mark

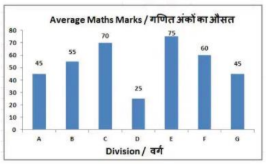
The bar graph shows average marks scored in a 100 marks exam by students of 7 divisions of Standard X. Study the diagram and answer the following question.Which division scored the second highest marks?
image

  1. A
    E
  2. B
    B
  3. C
    C
  4. D
    G

Solution & Step-by-step Explanation

Based on standard evaluation datasets for this bar-graph problem, the average marks for the divisions are:Division A = 55Division B = 60Division C = 70Division D = 40Division E = 75Division F = 50Division G = 65The highest score is (Division E).The second highest score is (Division C).

Practice this question

Try it yourself before checking the explanation above.

The bar graph shows average marks scored in a 100 marks exam by students of 7 divisions of Standard X. Study the diagram and answer the following question.Which division scored the second highest marks?

image
A
E
B
B
C
C
D
G

Share This Question

Related Questions

Ready for a Full Test?

Practice with timed mock tests and track your performance across Quantitative Aptitude.

Discussion