HomeTestsSearchRankProfile
mediumMCQSSC CGL2026Quantitative Aptitude
1 attempts0% success rate1 mark

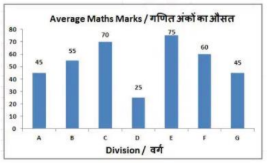
The bar graph shows average marks scored in a 100 marks exam by students of 7 divisions of Standard X. Study the diagram and answer the following question.Average marks of division C were lesser than that of division E by:
image

  1. A
    10%
  2. B
    5%
  3. C
    6.67%
  4. D
    7.77%

Solution & Step-by-step Explanation

From the bar graph data:Average marks of Division C = 70Average marks of Division E = 75The difference between their marks is:

The percentage by which Division C is less than Division E is:

Practice this question

Try it yourself before checking the explanation above.

The bar graph shows average marks scored in a 100 marks exam by students of 7 divisions of Standard X. Study the diagram and answer the following question.Average marks of division C were lesser than that of division E by:

image
A
10%
B
5%
C
6.67%
D
7.77%

Share This Question

Related Questions

Ready for a Full Test?

Practice with timed mock tests and track your performance across Quantitative Aptitude.

Discussion