The bar graph shows information about the sales of wrist watches from five branches and of company 'ABC' in 2016 and 2017. If the sum of sales of all branches in 2016 is units and in 2017 is units, find the ratio of total sales of all branches for the year
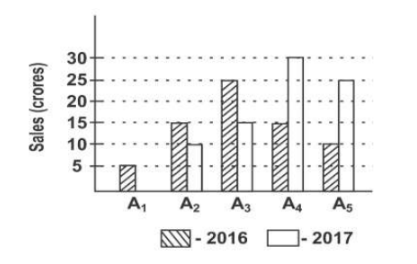
2016 to 2017.
- A9:4
- B9:7
- C7:6
- D7:9
Solution & Step-by-step Explanation
Given:
Total sales of all branches for the year 2016 =
Total sales of all branches for the year 2017 =
We need to calculate the ratio of total sales of 2016 to 2017:
Simplify the fraction by dividing both numerator and denominator by :
Thus, the ratio is .
Total sales of all branches for the year 2016 =
Total sales of all branches for the year 2017 =
We need to calculate the ratio of total sales of 2016 to 2017:
Simplify the fraction by dividing both numerator and denominator by :
Thus, the ratio is .