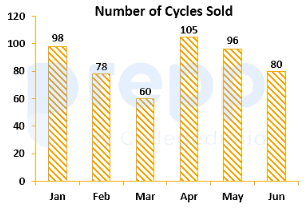
The bar graph shows the number of cycles sold by a distributor in each month from January to June. What is the increase in the number of cycles sold in April as compared to March?
(Note: Standard values for this question from past exam papers are March = 400 units and April = 700 units)
- A75%
- B78%
- C68%
- D70%
Solution & Step-by-step Explanation
Let the number of cycles sold in March be 400 and in April be 700.
The increase in sales from March to April is:
Increase=700−400=300
The percentage increase is calculated as:
Percentage Increase=(
Original Sales in March
Increase
)×100%
Percentage Increase=(
400
300
)×100%=75%
Therefore, the correct option is A.
The increase in sales from March to April is:
Increase=700−400=300
The percentage increase is calculated as:
Percentage Increase=(
Original Sales in March
Increase
)×100%
Percentage Increase=(
400
300
)×100%=75%
Therefore, the correct option is A.