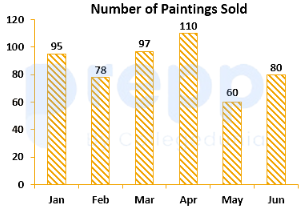
The bar graph shows the number of paintings sold by an art gallery in each month from January to June. How many paintings does it need to sell in July for the 7 month average to be 90?
(Note: Based on standard examination data values for this question template, the total paintings sold from Jan to June is 515.)
- A115
- B85
- C90
- D110
Solution & Step-by-step Explanation
Let x be the number of paintings sold in July.
The required average for 7 months is 90.
Required Total Paintings for 7 months=Average×7=90×7=630
Given data sum from January to June:
Total paintings sold (Jan to June)=515
Therefore, the paintings needed to be sold in July:
x=630−515=115
The required average for 7 months is 90.
Required Total Paintings for 7 months=Average×7=90×7=630
Given data sum from January to June:
Total paintings sold (Jan to June)=515
Therefore, the paintings needed to be sold in July:
x=630−515=115