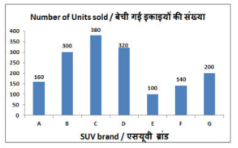
The bar graph shows the number of SUVs of different brands sold by a dealer in a month. Study the diagram and answer the following question.What is the ratio of units sold of brand G to that of brand A?
- A5:4
- B4:5
- C11:14
- D14:11
Solution & Step-by-step Explanation
From the given bar graph data, the units sold for brand G is and for brand A is .