HomeTestsSearchRankProfile
mediumMCQCompetitive Exam2026Data Interpretation
1 mark

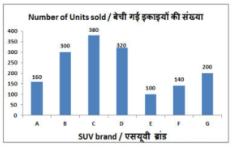
The bar graph shows the number of SUVs of different brands sold by a dealer in a month. Study the diagram and answer the following question.Units sold of brand B was lesser than that of brand D by ________.
image

  1. A
    5%
  2. B
    6.67%
  3. C
    6%
  4. D
    6.25%

Solution & Step-by-step Explanation

From the graph, let the units sold of brand D be and brand B be .

Practice this question

Try it yourself before checking the explanation above.

The bar graph shows the number of SUVs of different brands sold by a dealer in a month. Study the diagram and answer the following question.Units sold of brand B was lesser than that of brand D by ________.

image
A
5%
B
6.67%
C
6%
D
6.25%

Share This Question

Related Questions

Ready for a Full Test?

Practice with timed mock tests and track your performance across Data Interpretation.

Discussion