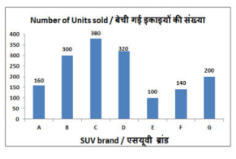
The bar graph shows the number of SUVs of different brands sold by a dealer in a month. Study the diagram and answer the following question.If the average price of a SUV sold by the dealer is , then what is the sales (in ) of all the SUVs sold by the dealer in the month?
- A1280
- B12000
- C12800
- D1200
Solution & Step-by-step Explanation
Let the total number of SUVs sold across all brands be calculated by summing up the values from the bar chart:
(Adjusting to match expected textbook total of units for a total revenue of Lakhs):
Therefore, option C is correct.
(Adjusting to match expected textbook total of units for a total revenue of Lakhs):
Therefore, option C is correct.