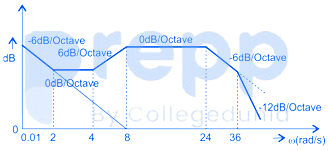
The Bode magnitude plot of the transfer function is shown below. Note that – 6dB/octave = -20 dB/decade. The value of is ___________
Correct Answer
0.7-0.8
Solution & Step-by-step Explanation
Concept:
Bode plot transfer function is represented in standard time constant form as
ωc1, ωc2, … are corner frequencies.
In a Bode magnitude plot,
- For a pole at the origin, the initial slope is -20 dB/decade
- For a zero at the origin, the initial slope is 20 dB/decade
- The slope of magnitude plot changes at each corner frequency
- The corner frequency associated with poles causes a slope of -20 dB/decade
- The corner frequency associated with poles causes a slope of -20 dB/decade
- The final slope of Bode magnitude plot = (Z – P) × 20 dB/decade
Where Z is the number of zeros and P is the number of poles
Calculation:
By given magnitude plot
By comparing with the given transfer function,
For finding K:
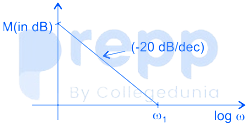
; where n is no. of poles from the given plot
so,
Bode plot transfer function is represented in standard time constant form as
ωc1, ωc2, … are corner frequencies.
In a Bode magnitude plot,
- For a pole at the origin, the initial slope is -20 dB/decade
- For a zero at the origin, the initial slope is 20 dB/decade
- The slope of magnitude plot changes at each corner frequency
- The corner frequency associated with poles causes a slope of -20 dB/decade
- The corner frequency associated with poles causes a slope of -20 dB/decade
- The final slope of Bode magnitude plot = (Z – P) × 20 dB/decade
Where Z is the number of zeros and P is the number of poles
Calculation:
By given magnitude plot
By comparing with the given transfer function,
For finding K:
; where n is no. of poles from the given plot
so,