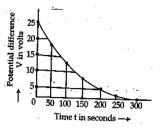
The figure shows an experimental plot for discharging of a capacitor in an R-C circuit. The time constant of this circuit lies between:(Note: Graph shows at , at , at )
- Aand
- Band
- Cand
- Dand
Solution & Step-by-step Explanation
In a discharging RC circuit, .When , we have: From the graph, . The voltage drops to (half) at approximately ..This value lies between and .