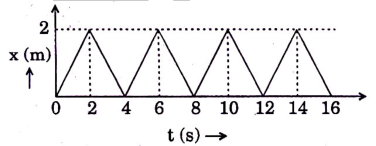
The figure shows the position–time () graph of one-dimensional motion of a body of mass . If the graph is a sawtooth wave with peaks at every , the magnitude of each impulse is:
- A
- B
- C
- D
Solution & Step-by-step Explanation
Impulse .From the graph, for , velocity .For , velocity .At , the change in velocity is .Magnitude of impulse .