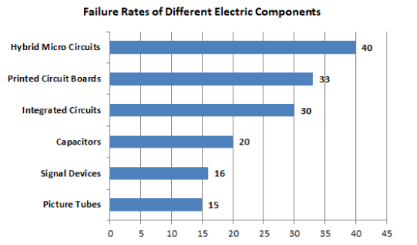
The following bar graph shows the failure rates (in thousands) for different electric components:How many times is the failure rate of hybrid micro circuits compared to that of signal devices?
- A5.2
- B0.4
- C4
- D2.5
Solution & Step-by-step Explanation
From the bar graph data:Failure rate of hybrid micro circuits = (in thousands)Failure rate of signal devices = (in thousands)Ratio: