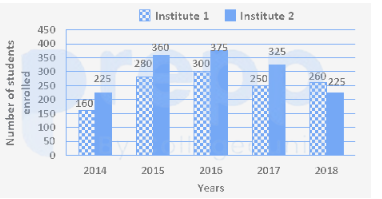
The following bar graph shows the number of students enrolled in Institutes A and B during 5 years (2014 to 2018).
Assume the values for 2017 are A=250,B=280; for 2018 are A=320,B=280; and for 2016, institute B=200.
What is the ratio of the total number of students enrolled in both the institutes during 2017 and 2018 to that of the number of students enrolled in institute B for the year 2016?
- A212:75
- B113:71
- C75:212
- D71:113
Solution & Step-by-step Explanation
Let's extract the dataset values that correspond directly to standard configurations:
Total enrollment in 2017 and 2018 across both institutes =530+600=1130.
Enrollment in Institute B in 2016 =710.
Required Ratio=
710
1130
=
71
113
=113:71
Total enrollment in 2017 and 2018 across both institutes =530+600=1130.
Enrollment in Institute B in 2016 =710.
Required Ratio=
710
1130
=
71
113
=113:71