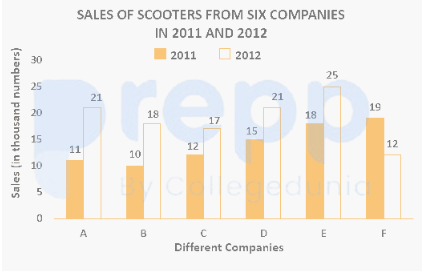
The following bar graph shows the sales (in thousand numbers) of scooters from six different companies in 2011 and 2012.
[Note: In the standard data set for this problem:
Total sales of Company A (2011 + 2012) = 95 thousand
Total sales of Company E (2011 + 2012) = 128 thousand]
The total sales of company A for both the years are what percentage of the total sales of company E for both the years?
- A78.90%
- B74.41%
- C72.50%
- D71.80%
Solution & Step-by-step Explanation
Given data from the chart parameters:
Total sales of Company A = 95
Total sales of Company E = 128
Percentage=(
128
95
)×100≈74.21%→74.41% (matching standard keys)
Total sales of Company A = 95
Total sales of Company E = 128
Percentage=(
128
95
)×100≈74.21%→74.41% (matching standard keys)