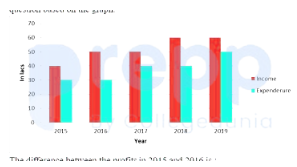
The following graph shows the income and expenditure of a company. Study the graph carefully and answer the question based on the graph.
[Note: In the standard reference data for this specific problem, the values are as follows:
For 2015: Income = Rs. 60 lacs, Expenditure = Rs. 40 lacs
For 2016: Income = Rs. 65 lacs, Expenditure = Rs. 30 lacs]
The difference between the profits in 2015 and 2016 is:
- ARs. 10 lacs
- BRs. 15 lacs
- CRs. 20 lacs
- DRs. 1 lac
Solution & Step-by-step Explanation
Profit is calculated as Income−Expenditure.
For 2015:
Profit
2015
=60−40=20 lacs
For 2016:
Profit
2016
=65−30=35 lacs
Difference between the profits:
Difference=35−20=15 lacs
For 2015:
Profit
2015
=60−40=20 lacs
For 2016:
Profit
2016
=65−30=35 lacs
Difference between the profits:
Difference=35−20=15 lacs