The following line graph gives the ratio of the amounts of imports by a company to the amount of exports from that company over the period from 1995 to 2001.
The ratio of the amount of imports to the amount of exports by a company:
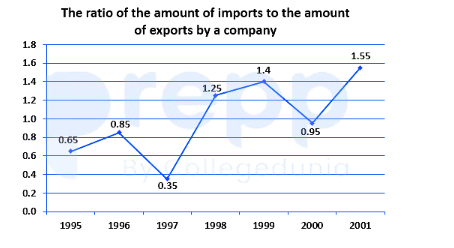
The imports were minimum proportionate to the exports of the company in the year:
- A1995
- B1996
- C1997
- D2000
Solution & Step-by-step Explanation
The question asks for the year in which the imports were minimum proportionate to the exports. This is equivalent to finding the year with the lowest ratio of imports to exports, as defined by:
From the given data, the ratios for the respective years are:
* 1995:
* 1996:
* 1997:
* 1998:
* 1999:
* 2000:
* 2001:
The minimum ratio value is , which occurs in the year 1997.
From the given data, the ratios for the respective years are:
* 1995:
* 1996:
* 1997:
* 1998:
* 1999:
* 2000:
* 2001:
The minimum ratio value is , which occurs in the year 1997.