The following line graph gives the ratio of the amounts of imports by a company to the amount of exports from that company over the period from 1995 to 2001.
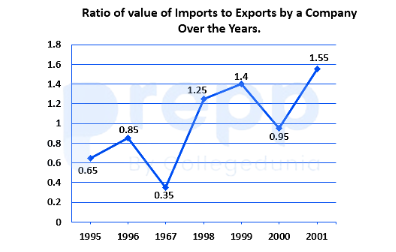
If the imports in 1998 was Rs. and the total exports in the years 1998 and 1999 together was Rs. , then the imports in 1999 was:
- ARs.
- BRs.
- CRs.
- DRs.
Solution & Step-by-step Explanation
1. Analyze the data for the year 1998:
Given that :
2. Find the exports for the year 1999:
Given that :
3. Calculate the imports for the year 1999:
Given that :
2. Find the exports for the year 1999:
Given that :
3. Calculate the imports for the year 1999: