The following pictograph table shows the number of scouts in a school across different classes:
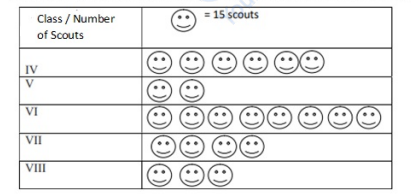
If each Smiley Face represents , what is the total number of scouts in classes VI to VIII?
- A200
- B320
- C195
- D225
Solution & Step-by-step Explanation
First, count the total number of smiley faces for classes VI, VII, and VIII:
Since each face represents , calculate the total number of scouts:
Since each face represents , calculate the total number of scouts: